


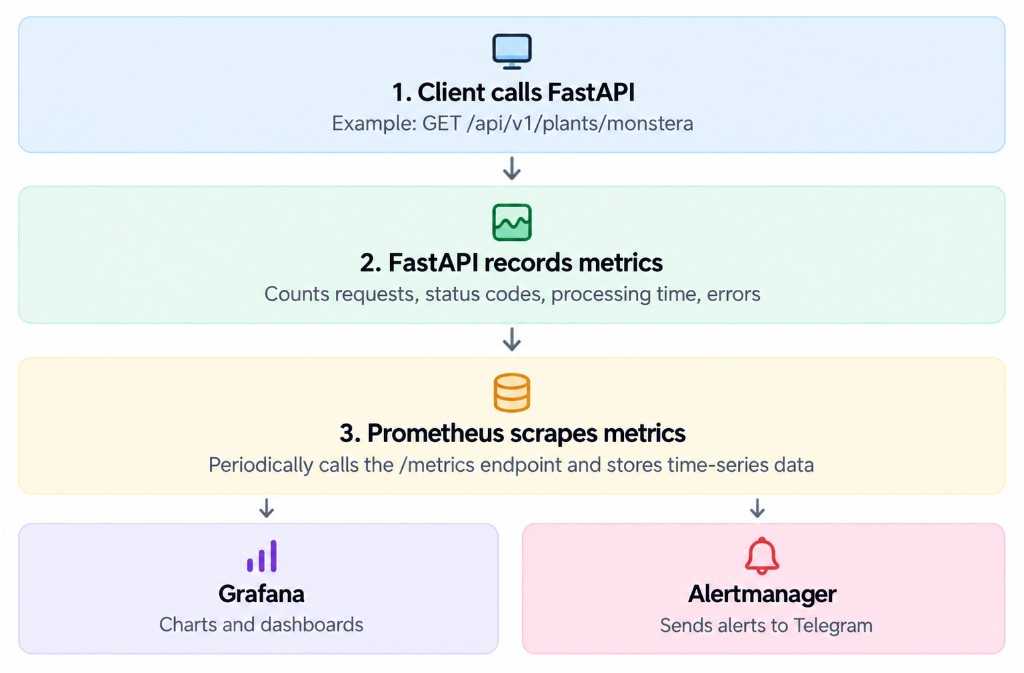
To monitor our FastAPI application running on a single VPS, we use Prometheus, Grafana, Alertmanager, and several exporters.
The monitoring workflow consists of five main steps:
Client calls FastAPI
For example, the frontend sends
GET /api/v1/plants/monsterato retrieve plant details.FastAPI records metrics
Middleware tracks HTTP requests, status codes, response times, and application exceptions.
Prometheus collects and stores metrics
Prometheus periodically scrapes the
/metricsendpoint exposed by FastAPI and other configured exporters. It stores the collected data as time series and evaluates alert rules.Grafana visualizes metrics
Grafana queries Prometheus using PromQL and displays metrics in dashboards, including request rates, error rates, latency, CPU, memory, and database statistics.
Alertmanager sends notifications
When an alert rule is triggered, Prometheus sends the alert to Alertmanager. Alertmanager groups and routes alerts, then sends Telegram notifications according to its configuration.
Basic Setup
In this section, we’ll set up a basic monitoring stack for a FastAPI application running on a single VPS using Docker Compose.
1. Project Structure
We can keep monitoring-related configuration separate from the application code:
project/├── app/│ └── main.py├── monitoring/│ ├── prometheus/│ │ └── prometheus.yml│ └── alertmanager/│ └── alertmanager.yml├── docker-compose.yml└── docker-compose.monitoring.yml
This separation makes the monitoring stack easier to configure and maintain.
2. Instrument FastAPI
Install the Prometheus Python client:
pip install prometheus-client
Expose a /metrics endpoint so Prometheus can collect application metrics:
from fastapi import FastAPI, Responsefrom prometheus_client import (CONTENT_TYPE_LATEST,generate_latest,)app = FastAPI()@app.get("/metrics", include_in_schema=False)def metrics():return Response(content=generate_latest(),media_type=CONTENT_TYPE_LATEST,)
In production, protect the /metrics endpoint and configure Prometheus to authenticate when scraping it.
3. Configure Prometheus
Create monitoring/prometheus/prometheus.yml:
global:scrape_interval: 15sscrape_configs:- job_name: "fastapi"metrics_path: /metricsstatic_configs:- targets: ["api:8000"]- job_name: "prometheus"static_configs:- targets: ["prometheus:9090"]
The api:8000 target refers to the FastAPI service name and internal port on the shared Docker network.
Prometheus scrapes the configured targets every 15 seconds and stores the collected metrics as time series.
If /metrics requires a token, configure bearer_token_file and mount the corresponding secret into the Prometheus container.
4. Run the Monitoring Stack
Add Prometheus and Grafana to your Docker Compose configuration. A minimal example is:
services:prometheus:image: prom/prometheus:v3.1.0ports:- "127.0.0.1:9090:9090"volumes:- ./monitoring/prometheus:/etc/prometheus:ro- prometheus_data:/prometheuscommand:- --config.file=/etc/prometheus/prometheus.yml- --storage.tsdb.path=/prometheusnetworks:- monitoringgrafana:image: grafana/grafana:11.4.0ports:- "127.0.0.1:3001:3000"volumes:- grafana_data:/var/lib/grafananetworks:- monitoringnetworks:monitoring:volumes:prometheus_data:grafana_data:
Make sure the FastAPI service also joins the monitoring network. If you’re using an existing application Compose file, merge the configuration rather than creating duplicate services or networks.
Start the stack:
docker compose \-f docker-compose.yml \-f docker-compose.monitoring.yml \up -d
Check the running containers:
docker compose ps
5. Verify Prometheus
Open the Prometheus Targets page:
http://localhost:9090/targets
If the target is UP, Prometheus can scrape its metrics endpoint successfully.
You can also open the Prometheus query page and run:
up
A value of 1 indicates that the corresponding target was successfully scraped. A value of 0 indicates a scrape failure.
6. Connect Grafana to Prometheus
Open Grafana:
http://localhost:3001
Add a Prometheus data source with the URL:
http://prometheus:9090
Use the internal service name when Grafana and Prometheus share the same Docker network. The URL http://localhost:9090 would refer to the Grafana container itself, not the Prometheus container.
After saving the data source, create a dashboard with panels for request rate, error rate, latency, and infrastructure resources. The corresponding metrics must be exported and scraped before those panels can display data.
7. Configure Telegram Alerts
Alerting requires two configurations: Prometheus alert rules and an Alertmanager receiver.
For example, a basic Prometheus alert rule might be:
groups:- name: api-alertsrules:- alert: FastAPIDownexpr: up{job="fastapi"} == 0for: 1mlabels:severity: criticalannotations:summary: "FastAPI is unavailable"
Configure Prometheus to load the rule file and send alerts to Alertmanager. Then configure Alertmanager with a Telegram receiver that uses a bot token and chat ID.
Keep the bot token in a secret file or another secure secret-management mechanism. Do not commit it to Git.
When the alert condition is met, Prometheus sends the alert to Alertmanager, which routes the notification to Telegram according to its configuration.
8. Access Monitoring Securely
For a single VPS, avoid exposing Prometheus and Alertmanager directly to the public Internet without appropriate authentication and access controls.
One simple approach is to bind their ports to 127.0.0.1 and access them from your local machine through an SSH tunnel:
ssh -N \-L 3001:127.0.0.1:3001 \-L 9090:127.0.0.1:9090 \-L 9093:127.0.0.1:9093 \user@your-vps
Replace user@your-vps with your actual SSH username and VPS address.
You can then open Grafana, Prometheus, and Alertmanager using their respective localhost URLs.
This approach keeps the monitoring interfaces private while allowing you to inspect application health and troubleshoot production issues.
